When running A/B tests, the goal is always to reach significant results. What exactly significant results mean is different for every organization, but in general, a statistical significance level of 95% or higher and statistical power of 80% or higher constitutes a valid test. Those numbers may change depending on an organization’s appetite for risk with testing and with the particular test specifically. A test that has organization-wide implications for a Fortune 100 company may need to reach a 99% significance level, whereas a simple headline test for a small start-up may only need to reach 90%.

What exactly does statistical significance/confidence level mean?
The phrase “statistical significance” gets used a lot in the testing industry, but surprisingly few people are using the term correctly. The technical definition is a bit nuanced and it is understandable how so many get confused.
To quote Evan Miller on the topic of what a confidence level means:
If the experiment is repeated many times, the confidence level is the percent of the time each sample’s success rate will fall within the reported confidence interval.
It is also the percent of the time no difference will be detected between the two groups, assuming no difference exists.
The first part of his definition is really the most important part. Running a confidence level calculation will return two important numbers, the confidence level percentage (the higher the better, and more than 95% is usually considered valid) and the confidence interval for each variation.
What is a confidence interval?
The confidence interval is the range of conversion rates you can expect to see if you were to repeat the experiment many times over, assuming the confidence level is high. A confidence interval is always just that, an interval or range of expected outcomes, not an exact number. That fact makes it much more difficult to succinctly present and interpret the results of a test.
Quick Example
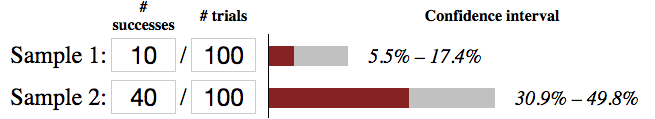
In this example, Sample 2 is more successful than Sample 1 with a 99% confidence level. But just how much better is it? The simple way to perform this would be to compare the 10% conversion rate of Sample 1 to the 40% conversion rate of Sample 2. That comparison would yield a 400% difference. But that only tells us how the two samples performed during the test, it doesn’t help us determine what we can expect for future performance. Notice the confidence intervals and how wide they are. Based on the intervals, we could expect Sample 1 to perform between 5.5% and 17.7% and Sample 2 to perform between 30.9% and 49.8%, 99% of the time. Comparing 17.7% to 30.9% and 5.5% to 49.8% we can predict that Sample 2’s performance to be between 175% and 905% of Sample 1’s performance. That’s a very large gap so to make the intervals tighter and more accurate we can run tests longer and collect more samples.
What does statistical power mean, and does it really matter?
Statistical Power is the measure that the results of a given experiment are representative of true results and not just luck, assuming a difference exists. Basically, it is one of the measures one needs to look at for repeatable and reliable results based on results and sample set from an experiment. So yes, it matters.
Layman’s terms: power is a rating (higher is better) of the results and observations that what you recorded as “results” from the test were actually due to the changes in the experiment, not from luck, such as one variation receiving a disproportionate influx of high converting users.
While it is rare to be able to test, devoid of many outside factors, that does not mean you need to settle for results with low power rates.
Where this can come back to bite you is when a test is declared a winner, but in implementation, the business is not observing those promised “gains”.
Power also comes into play pre-test launch, when you are determining sample sizes — higher power rate more samples needed. While 80% is standard within most industries running experimentation, as mentioned above, some smaller companies with lower traffic or companies with aggressive testing teams might be fine with a smaller threshold.
What factors influence significance?
There are three main factors that directly affect how quickly tests will reach significance; amount of traffic per variation, number of conversions per variation, and how different the conversion rate is between the A and B versions. Simply put, more traffic, more conversions, and more of a difference will yield significant results more quickly.
| Results | Traffic | Conversions | # of Variations |
|---|---|---|---|
| Faster Results | |||
| Slower Results |
Practically speaking, all three of those factors are necessary to reach a significant result. Lacking even just one factor will not allow a test to reach significance.
I’m not good at statistics, are there tools I can use to measure significance?
Fortunately, there is plenty of easy-to-use and free tools that make the tough calculations for you.
For measuring statistical significance, see our review of several top test significance calculators.